How to Install Cacti on Ubuntu to Graph SNMP Traffic
Install Cacti on Ubuntu 24.04 with apt, add a switch over SNMP, and draw your first traffic graph, plus why there's no setup wizard and how to verify the graph.

- Before You Install: Ubuntu and SNMP Prerequisites
- Installing Cacti with apt
- Why the Web Setup Wizard Never Appears
- First Login, Password, and Interface Language
- Adding a Switch and Its First Graph
- Reading the Graph: Inbound, Outbound, and Peaks
- Checking the Graph Against the Raw Counter
- Make Sure Your Test Traffic Crosses the Interface You Graph
- Verification and Common Problems
- Configuring Panels: Field Recommendations
- Conclusion: Installation Done, Monitoring Starts Now
Installing Cacti on Ubuntu is a few packages, a database, and a web server. The catch isn’t the installation; it’s that the screen you land on afterward isn’t the one most online guides show. This guide installs Cacti 1.2 on Ubuntu 24.04 with apt, puts a switch under monitoring over SNMP, draws the first traffic graph, and then checks that graph against the switch’s raw counter. It’s part of the network monitoring and alerts guide.
The easiest way to place Cacti in your head is as your network’s electricity meter. You don’t look at a meter to ask “how much is it drawing right now”; you look at the month’s consumption curve to see when the load climbs. Cacti does exactly that: it polls devices every five minutes, turns the differences into a curve, and leaves you not an instant alarm but a trend over time. Commands, outputs, and screenshots come from the author’s lab (switch sercebilisimsw01, Cacti server sercecacti), left as captured.
Before You Install: Ubuntu and SNMP Prerequisites
This guide assumes Ubuntu Server 24.04 LTS is already installed and you have sudo rights.
The second prerequisite is that the device you’ll monitor speaks SNMP. Cacti doesn’t produce data itself: it asks a switch, router, or server over SNMP and turns the counter values into graphs. So what SNMP is, and why a community string is a weak gate, is the ground to stand on before installing; it’s covered in What Is SNMP?
Hardware needs are modest. Cacti is a PHP application in the LAMP mold and runs comfortably on a small server: the lab ran it on 2 vCPUs and 2 GB of RAM without trouble. The real constraint isn’t CPU but disk, because Cacti keeps RRD files per device and graph, and they grow. Leave plenty of room as the number of devices and graphs grows.
Installing Cacti with apt
Cacti is a ready package in Ubuntu’s repository:
sudo apt update
sudo apt install cacti
While it runs, the installation asks a few questions. The blue debconf dialogs that appear are Cacti’s real setup interface, not the browser wizard in online guides. In order:
- Web server. Apache or lighttpd; the standard choice is
apache2. - Configure the database with dbconfig-common. Answer
Yes; the package creates the database, loads the schema, and sets up the connection for you. - Database passwords. First the MySQL administrator password, then the password Cacti’s own account will use.
That’s all apt asks. Note the first surprise: you weren’t asked to install MariaDB. The Ubuntu 24.04 package uses MySQL 8.0 in the background and installs the schema ready-made, 113 tables. The “install MariaDB first” step many guides start with is unnecessary for this package. Check the services:
systemctl is-active apache2 mysqlactive
activeWhy the Web Setup Wizard Never Appears
A Cacti installed from the Ubuntu package has no browser-based setup wizard; after logging in you land directly in the management console. That doesn’t mean the installation is incomplete. The package deliberately skips the upstream release’s wizard, the one that opens with a “Pre-installation Checks” screen.
Knowing this explains a contradiction you’ll meet online. Search for how to install Cacti and many top results, including AI-generated summaries, say “complete the remaining steps in the web interface” and describe a wizard. That wizard is what people see when they install Cacti from the source tarball. Nobody installing the Ubuntu package ever sees it, because the package sets up the database with dbconfig-common during apt and drops you straight into the console. The practical value: you won’t reinstall because a wizard didn’t appear. If the console opens, the installation is done.
First Login, Password, and Interface Language
Open Cacti in a browser at your server’s address with the /cacti path, for example http://server-address/cacti. The initial username and password are admin / admin, and Cacti forces a password change at first login. Choose a strong one right away; the default account is a door known worldwide.
The first oddity after logging in may be the interface language. Cacti detects the language from your browser by default, and several of its translations are only partial: the Turkish catalog on the lab server, for example, carried only a few hundred strings. With a browser set to such a language, some labels appear translated and most don’t. For screenshots and consistent team documentation, that mix is unwelcome.
The fix is to pin one language. Under Console, go to Configuration, then Settings, then the General tab, choose the default language, and turn off automatic browser detection. The lab server was pinned to English this way. Individual users can still choose their own language from the account menu at the top right.
Adding a Switch and Its First Graph
Cacti is empty after login; you give it work by adding devices. The device here is a managed switch. Both sides must be ready: SNMP enabled on the switch, the device defined in Cacti.
On the switch, define a read-only SNMP community string first. The one rule is never to leave it at the default public. public is monitoring’s locked door with the key taped to it: the community string travels in plain text, so a guessable value invites anyone to read every counter on the device. Choose a string that’s hard to guess and, if the switch allows it, accept queries only from the monitoring server’s address.
Then add the device in Cacti. Under Console, Create, New Device opens a new device; the simplest vendor-neutral route is the Generic SNMP Device template. Enter the device’s IP address, SNMP version (v2), and the community string, and save. If Cacti can reach the device, it discovers the interfaces itself; on the lab switch it found 119.
The value starts when you pick an interface to graph. For bandwidth, the right graph template is Interface - Traffic (bits/sec). Choose an interface that carries traffic, such as the uplink port, and create the graph. From here, Cacti runs on its own.
What runs it is the poller. The installation puts a scheduled job in /etc/cron.d/cacti that runs every five minutes. Each run reads the device’s SNMP counters and writes them to the RRD file. That’s also why a new traffic graph looks empty at first: interface traffic is a counter, an ever-growing total. Cacti can only compute a rate from the difference between two readings. The first poll only records a starting value; the first real bits-per-second value arrives with the second poll, five minutes later.
Reading the Graph: Inbound, Outbound, and Peaks
The key to reading a traffic graph is one word: direction. Inbound and Outbound are defined relative to the monitored interface, not to your computer. The most common mistake is reading them as “download” and “upload.”
Inbound is traffic entering that port; outbound is traffic leaving it. On an uplink port, inbound is traffic arriving from the router, outbound is traffic from the switch toward it. The same data appears with the opposite name on the neighboring port, so direction is always relative to the interface you’re looking at. The legend reads like this:
- Inbound (filled green area): traffic into the interface, in bits per second.
- Outbound (blue line): traffic out of the interface, drawn over the green area.
- Current, Average, Maximum: the last poll’s value, the average over the window on screen, and the peak.
For capacity decisions, the column that matters is Maximum: if a 100 Mbit link’s peak sits near 95 M, it has started to saturate even when the average looks comfortable.
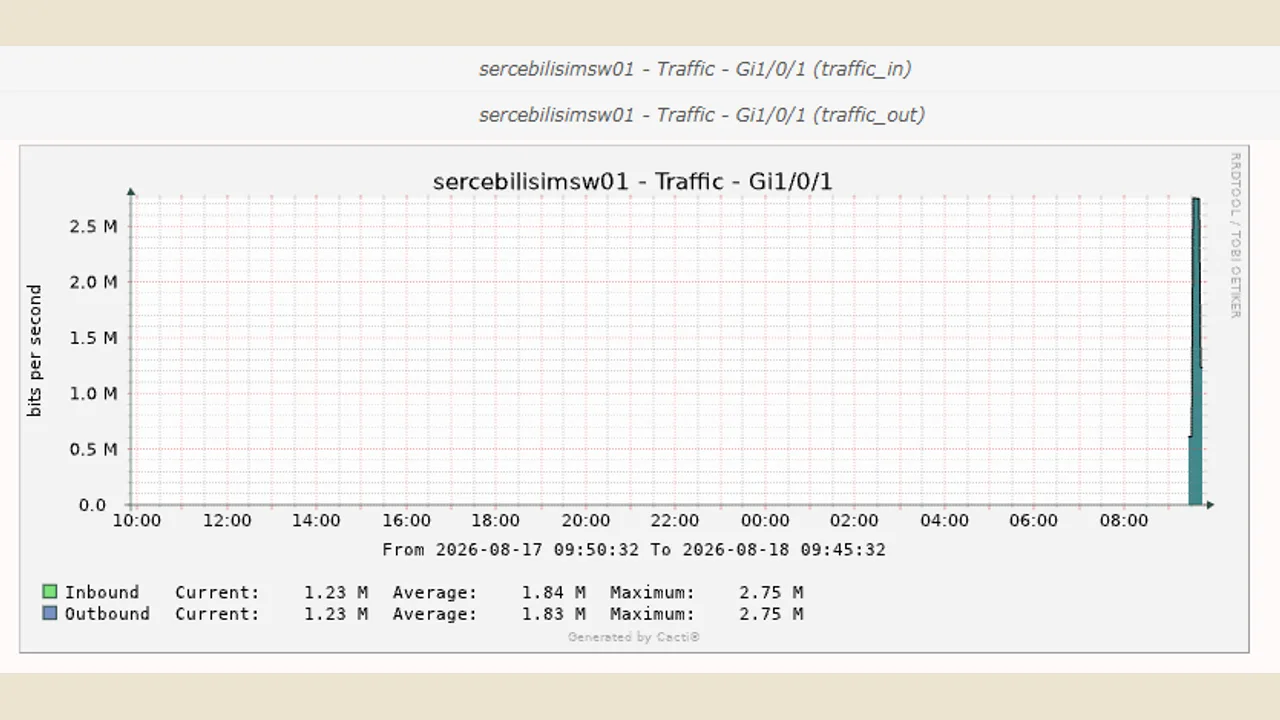
There’s also a small unit trap. The raw value Cacti writes to the RRD file isn’t bits but octets, that is, bytes; the graph template multiplies by eight to show bits per second. So don’t panic at an RRD value such as 343,934: on the graph it correctly appears as 2.75 M, about 2.75 Mbit/s. In the lab, with a controlled load on the uplink, the curve showed exactly that: a climb from a quiet baseline to a plateau at about 2.75 Mbit/s.
Checking the Graph Against the Raw Counter
The Turkish original of this article stops at “the graph shows 2.75 Mbit/s.” A graph is a calculation, though, and it’s worth checking a calculation against its input once, especially on a new installation. You can do it by hand from the switch’s own interface counter, independently of Cacti’s arithmetic.
During the plateau above, the uplink’s raw inbound counter read about 9 million bytes at 09:29 and about 224 million at 09:40: roughly 214 MB over about ten minutes. Convert: 214,000,000 bytes × 8 ÷ 600 seconds is about 2.85 Mbit/s. The graph showed 2.75 Mbit/s. The two agree within a few percent, and the small gap is expected: the counter readings weren’t taken exactly on the poller’s five-minute boundaries, and the graph’s value is an average over a polling interval.
Two lessons come from doing this once:
- The ×8 happens in the template, and it’s correct. If your graph and the counter disagree by a factor of eight, someone built a graph from a bytes template and labeled it bits, or the reverse.
- A graph that agrees with the raw counter can be trusted for decisions. Do this check when you add a new device type or template; after that, the graphs speak for themselves.
Make Sure Your Test Traffic Crosses the Interface You Graph
The second lab finding also isn’t in the Turkish original, and it’s the kind of mistake that makes a correct installation look broken.
The obvious way to put load on the uplink is to download something large from the internet on the Cacti server. Before relying on that, I measured which traffic actually crosses the port, and the obvious way would have failed: the Cacti virtual machine was bridged to the host’s Wi-Fi adapter, so its internet traffic left through the wireless side and never crossed the switch port being graphed. A download would have produced a flat graph and looked like a monitoring fault. Traffic between the Cacti server and the switch itself, however, did cross that port. A 20-second continuous ping from the Cacti server to the switch moved the port’s inbound counter from 599,123 to 9,271,035 bytes, about 8.67 MB, and that is the load that produced the plateau above (large packets, rate-limited, entirely inside the LAN, so no internet data was spent).
The general rule: before you conclude a graph is wrong, confirm your test traffic actually crosses the interface you’re graphing. Check the interface counter directly; if it doesn’t move, the problem is your test path, not the monitoring.
Verification and Common Problems
A monitoring setup isn’t finished until “is data really arriving?” is answered. You can check that the server reaches the switch over SNMP from the command line, without waiting for the graph. With the snmp tools installed, ask for the device’s system name:
snmpget -v2c -c YOUR_COMMUNITY -Oqv 192.168.1.2 .1.3.6.1.2.1.1.5.0"sercebilisimsw01"If it returns the name, the SNMP path works end to end. The instructive part is the opposite case. Ask with a wrong community string and the device doesn’t return an error; it doesn’t answer at all:
snmpget -v2c -c wrongpassword -t1 -r0 192.168.1.2 .1.3.6.1.2.1.1.5.0Timeout: No Response from 192.168.1.2.A wrong community isn’t rejected; it’s silently dropped. So “no response” doesn’t always mean “device down”; you may have mistyped the string. Check the string first, then reachability. If the MIB text files aren’t installed, symbolic names such as sysName.0 won’t resolve and you’ll use numeric OIDs, as above; that’s not a fault, and Cacti itself works with numeric OIDs anyway.
The snags you’re most likely to hit:
php-intlmay be missing. It’s among Cacti’s required PHP extensions, but the Ubuntu package doesn’t always pull it in. If it’s missing, runsudo apt install php-intland restart Apache.- Cacti’s database check never turns fully green on MySQL 8.0. Some MySQL variables Cacti recommends (
innodb_file_format,innodb_large_prefix,table_cache, and others) were removed entirely in MySQL 8.0. Warnings for them on the Technical Support page are normal and don’t block anything. - Performance recommendations assume a busy production server. Scale Cacti’s memory and thread suggestions to your machine; even its own description of
innodb_read_io_threadssays to keep it below your core count. - Don’t leave logs reachable from the web. Cacti’s directory tree sits close to the web root; block outside access to the
logandrradirectories in the web server configuration, or scan records can become readable without authentication.
Configuring Panels: Field Recommendations
Once one interface is graphed and read correctly, the question becomes which of dozens of devices and hundreds of interfaces go on screen first.
First, the port that talks to your ISP’s router. It’s usually the first graph worth building, because all internet traffic crosses that one interface and its curve answers both capacity and “why is the internet slow.” The real value shows on ordinary days, not during an outage: seeing how full a 200 Mbps line gets at regular intervals is more revealing than you’d expect, and only this curve tells you the line hits its ceiling at the same time every morning or empties out at lunch. Compare its peak with the line’s capacity to read utilization; Cacti also has a template that draws bandwidth directly as a percentage when the interface speed is defined.
Use the list view as graphs multiply. Next to the tree view, the Graphs tab has a preview mode that lays out all of a device’s graphs as small cards on one page, with an adjustable column count.
Put the critical ones on a wall. A spare monitor at head office showing a two-column, four-row grid moves monitoring off desktops. And fill it with the same property of many devices rather than many properties of one: every site’s internet uplink side by side reveals the one that’s at its ceiling. The trap is to look at one site’s uplink and assume “they’re all 200 Mbps, so they’re all fine.” Even with identical lines, a site you’re not watching can be pinned at its ceiling, and that’s exactly the bottleneck you miss.
Graph device health, not just traffic. Temperature, CPU, and memory over SNMP show what no one would guess: identical switches in different rooms age on completely different curves, depending on dust, heat, and ventilation. Disk usage, UPS status, and latency to key destinations are worth graphing too.
You can’t know these weaknesses in advance by some near-divine intuition; you can’t manage what you don’t measure, and that means listening to what the devices themselves report.
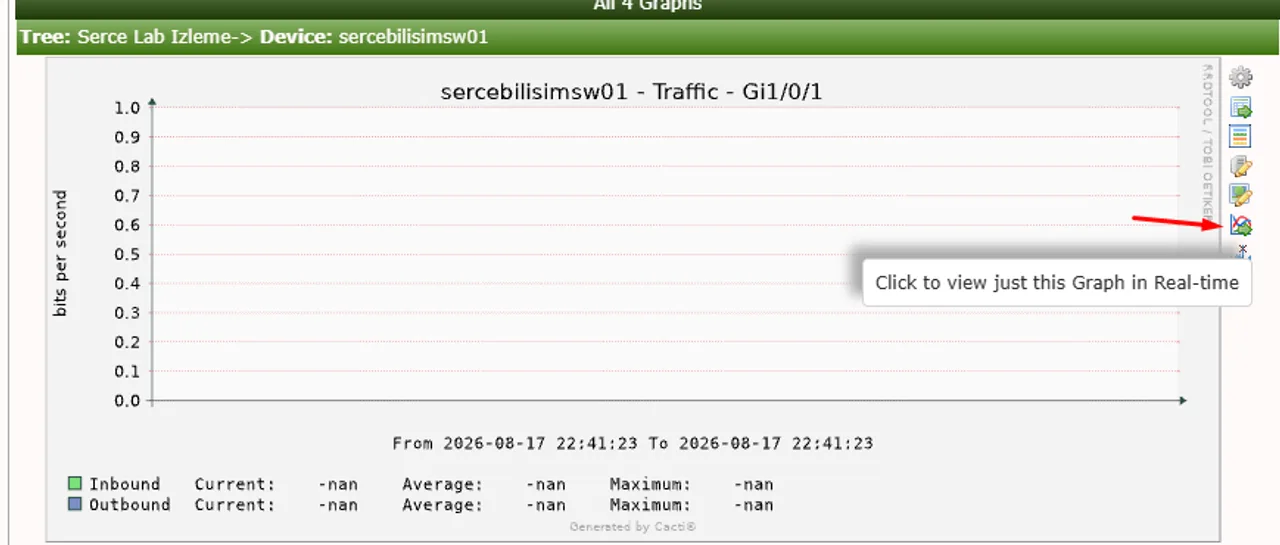
Live view or recorded history? Cacti’s real-time mode polls one graph every few seconds and is invaluable while someone is actively watching a problem. For a team that opens monitoring only when needed, the default recorded history is far more useful. Open real-time from the icon column on the right of each graph.
Conclusion: Installation Done, Monitoring Starts Now
Installing Cacti, adding a device, and drawing the first graph is half a day’s work. The real work is having someone look at the graphs. The most common failure is a monitoring tool set up “so we have one” and left ownerless, a dashboard nobody opens six months later.
Cacti is enough on its own, but its value shows as part of an architecture: Cacti graphs capacity, an alerting tool such as Zabbix turns availability into alarms, and logs arrive through a syslog server. Being clear about which tool answers which question matters more than installing any of them. And check each new graph once against its raw counter: a graph you’ve verified is one you can make decisions from.
Questions about installing Cacti
This article is adapted from a guide the author first published in Turkish on sercebilisim.com: Cacti Kurulumu: Ubuntu'da SNMP ile Ağ İzleme

Written by
İlker PehlivanNetwork and systems engineer, founder of Serçe Bilişim
I run the networks and servers that other people's work depends on. Before founding my own consultancy I administered the backbone network, firewalls and core systems of a large multi-site organisation with thousands of users. I write about the things that actually broke.
Related articles
What Is SNMP? MIB, OID, Traps, and SNMPv3
How SNMP polls devices and receives traps, what MIBs and OIDs are, why a v2c community string is not a password, and how SNMPv3 fixes it, shown byte by byte.
How to Set Up a Syslog Server on Ubuntu with rsyslog
Build a central syslog server on Ubuntu 24.04 with rsyslog: open UDP 514, split logs per sender, connect a switch, plan disk and rotation, and add TLS on 6514.
What Is NTP? Clock Synchronization and Stratum
What NTP is, why clocks drift, how the stratum hierarchy decides who gets time from whom, what breaks when clocks disagree, and the common sync traps, with a captured exchange.
What Is Syslog? Facility, Severity, and Port 514
What a syslog line looks like, how facility and severity share one number, and why port 514 is UDP, explained with real output captured from a lab switch.
On this page
Part of this guide
Network Monitoring and Alerts: What to Watch and Alert On